Exploratory Data Analysis of the Murders Dataset in R
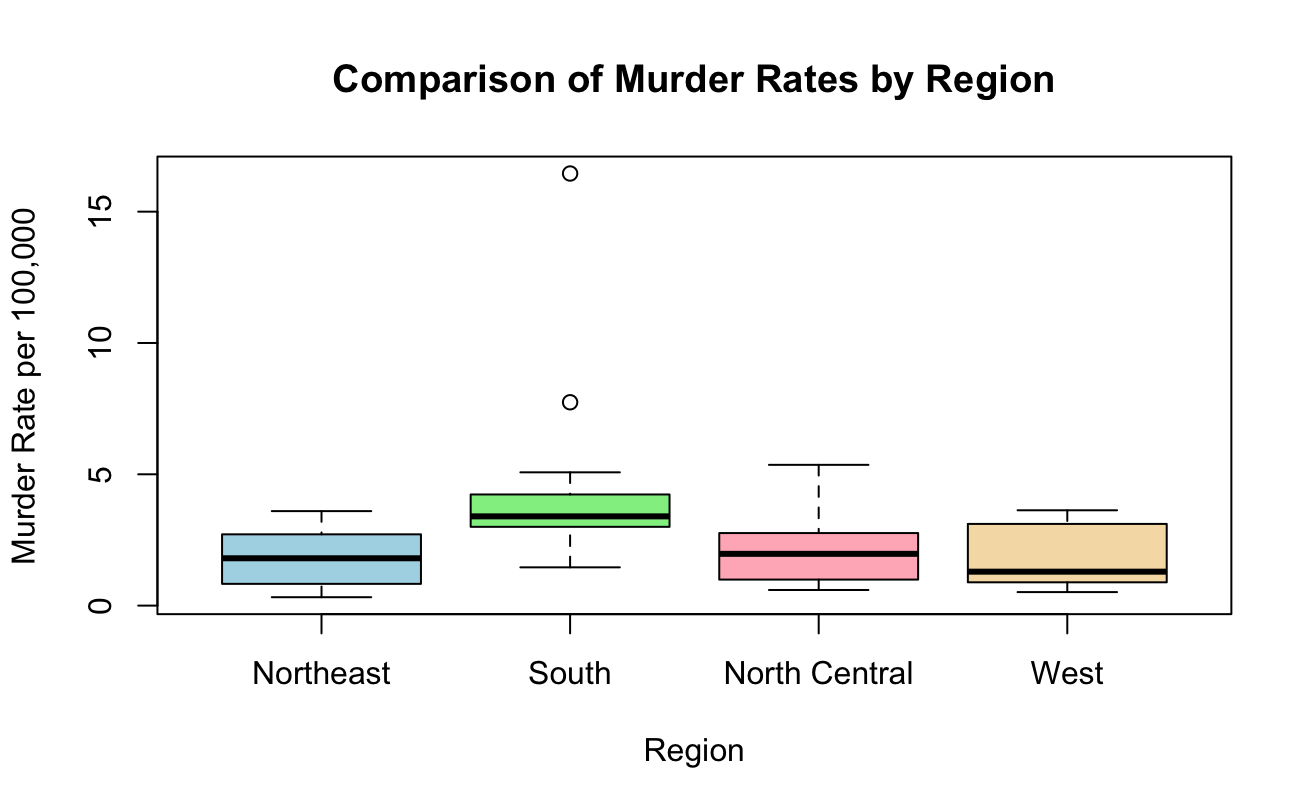
In this EDA project on the "murders" dataset in R, we examined data structure, identified the state with the highest murders, and analyzed murder rates. We visualized data using scatter plots, histograms, and boxplots to compare murder rates by population and region. Key R tools included functions like names(), which.max(), plot(), and libraries such as dplyr and ggplot2 for efficient data manipulation and visualization.